Basically, I am doing a research study on the seniors that attend a school in Jefferson Parish. For those of you who don’t know what a parish is, it is equivalent to a county of a state. Okay, so I want to know how many minutes students across my school district spend on homework each night. I want to see whether I am getting too much homework that is taking up my whole night, or are there students who are getting more homework than me? Since Jefferson Parish is divided into two sections, the east bank and west bank, I will be comparing the data of the two regions. My data will be measured in minutes, since I am asking students how many minutes they spend each school-night doing homework. So let’s find out some more information as to how I am going to be doing this. In the blog before this one, I stated the procedure that I will be using to collect this data. Once my teacher checks that I am going in the right direction with this project, I will write a quick memo as to why I need this data and send it out to the counselors of the different high schools. I plan on having all the data in need within the next three weeks because I need time to analyze the data and from a previous project that I have done in this class, I know that it takes a lot of time to do that. And of course, all the above mentioned will be done by yours truly: me. Now that I have all the data, what exactly am I going to do with it?? Well, for starters, I will have to calculate a numerical summary of the data. This numerical summary will include the minimum value, Q1 (the 25th percentile value which is the value where 75% of the data falls below), the median or middle value, Q3 (the 75th percentile value which is the value where 75% of the data falls below), the maximum value, the mean and the standard deviation. The graphs that I will use to display my d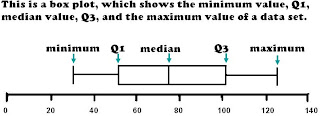 ata are a box-plot, histogram, an ogive, and a two-way table. I will make three types of box-plots, histograms, and ogives, which will display all of the data, just east bank data, and just west bank data. This way, I can easily compare the east bank to the west bank. I will construct only one two-way table which will show east bank data on one side and west bank data on another side. Once I get all of my data, I will graph it and analyze the data and I will definitely post all of my results on this blog. :)
 ata are a box-plot, histogram, an ogive, and a two-way table. I will make three types of box-plots, histograms, and ogives, which will display all of the data, just east bank data, and just west bank data. This way, I can easily compare the east bank to the west bank. I will construct only one two-way table which will show east bank data on one side and west bank data on another side. Once I get all of my data, I will graph it and analyze the data and I will definitely post all of my results on this blog. :)
Subscribe to:
Post Comments (Atom)

Cinnamon M Says:
I liked the how you wrote like you were talking to someone. It feels like we are conversation. Good job Sobia! :-)
Posted on March 2, 2009 at 9:29 AM